ICRFS™ Demonstration videos and powerpoint slide show
ICRFS™ is a tour de force of interactive software design and computational speed.
An ICRFS™ corporate database enables complete executive oversight. This means that that you will be able to find, with just a few mouse clicks:
- models and reports for any segment of your business in any country,
- the actuary modeling that segment of the business,
- capital allocation by LOB and calendar year,
- reserve risk charge and underwriting risk charge for the aggregate of LOBs,
- whether outward reinsurance is effective in respect of reducing retained risk,
- and more!
Rather than store data in spreadsheets, all actuarial related data are stored in ICRFS™ databases – including any models, forecast scenarios, and any other data related to actuarial requirements. The data can either be stored in Insureware’s proprietary format within the database (imported), or linked directly to claims data warehouses where structured tables in the ICRFS™ Open Data Architecture (IODA) format have been created allowing ICRFS™ to query the data warehouses directly and create loss development arrays on the fly.
ICRFS™ also includes metrics and calculations essential for IFRS 17 - including the calendar year liability stream, forecast scenario tracking, and distinguishing between earned premium and unearned premium.
Insureware's solution to the one year risk horizon, relevant for Solvency II Capital Requirements (SCR), Market Value Margins (Risk Margins) and Technical Provisions (Fair Value of Liabilities), for the aggregate of multiple LOBs, is covered in video chapter 5. Solvency II Capital requirements for each LOB and the aggregate of all LOBs are only met by ICRFS™ in a sound statistical framework.
View the videos below to experience the numerous unique benefits and applications afforded by the paradigm shift from link ratios to measuring trends. Some of the (real) case studies modelled in the videos are also discussed briefly in the ICRFS™ brochures. These videos are arranged in logical order so it is important that you view them that way.
For additional information on new functionality in ICRFS™ - click here.
Contents
1. Introduction to ICRFS™
1.1 General Introduction
1.1.1 Relational database and COM technology
The database functionality is demonstrated. Data, models and reports all reside in one relational database that can be configured in any way by the users. Communication between two databases has the same intuitive feel as using Windows Explorer for communicating between two sub-folders. Importation of triangles, from other applications including unit record transactional data, into an ICRFS™ relational database is effortless using the COM technology.
1.1.2 modeling, paradigm shift and benefits
ICRFS™ is the key to a new innovative paradigm in for measuring and managing long (and short) tail liability risks. The various modules (modeling frameworks) LRT, ELRF, PTF and MPTF of the system are introduced. The critical difference between variability and uncertainty is illustrated with two gambling examples. The numerous benefits and applications afforded by the unique paradigm shift are also described.
1.2 The LRT and ELRF modeling frameworks
1.2.1 The Link Ratio Techniques (LRT) modeling framework
The Link Ratio Techniques (LRT) module is described using the incurred (Mack) array. It can be applied to any incremental or cumulative array. There are numerous choices in selecting and smoothing link ratios (age to age development factors) to any ultimate period. Selected link ratios (methods) can be saved and run at any time to obtain forecasts including Bornheutter Ferguson. The context sensitive help (topic help) is also shown. Demonstration video 5.2 illustrates the flexibility of report templates including post-processing of ICRFS™ generated tables.
1.2.2 The Extended Link Ratio Family (ELRF) modeling framework
Weighted average link ratio methods can be regarded as average trends (slopes through the origin), and accordingly are formulated as regression estimators in the ELRF module. The default starting method in the ELRF modeling framework is the so-called Mack Method which is the regression equivalent formulation of volume-weighted-average link ratios. These regression methods (through the origin) are extended to include intercepts, and constant trends across the accident years in the incrementals for each development period. A number of diagnostic tests are provided for identifying the best model in this family. Forecast standard errors are also given.
Three mutually exclusive conditions satisfied by data are introduced. For all but one development period the Mack incurred data satisfy condition 1. Even where the development period satisfies condition 2, link ratios do not have any predictive power (for this incurred array). This study is also discussed in the paper "Best Estimates for Reserves".
Also see demonstration videos 9.1-9.5 to see how the bootstrap can be used to test whether the Mack (and related) methods work for a dataset.
1.3 The Probabilistic Trend Family (PTF) modeling framework
The Probabilistic Trend Family (modeling framework) is introduced in this session. Axiomatic trend properties of trends satisfied by every triangle are explained using a simple example. Subsequent to adding process variability to the trend structure, the data are modeled in order to explain a number of statistical concepts. A model is represented by four pictures (graphs); each picture has a simple interpretation. Any three out of the four pictures are meaningless (without the fourth). This study is also discussed in the paper "Best Estimates for Reserves".
2. Applications: PTF and ELRF
2. Applications of the PTF and ELRF modeling frameworks
2.1 Triangle Group CTP-The model building process
A model is identified (built or designed) in the PTF modeling framework for the real data CTP, first manually, in order to illustrate some intuitive statistical concepts. Validation analyses are used to confirm the stability of trends, and to extract additional information from the data. The warp speed modeling wizard identifies the same model in less than one second, which was designed manually in a few minutes. The cumulative data are modelled in ELRF and as a result of condition 1 being satisfied, link ratios have no predictive power whatsoever.
2.2 Triangle Group ABC-Major shifts in calendar year trends and testing for model specification error
The triangle group ABC has major shifts in calendar year trends and very little process variability. The PTF model is identified by the warp speed wizard. Analyses of the cumulative data are also conducted in ELRF that includes the Mack Method. These methods do not capture the calendar year trend shifts as shown in the residual graphs. In ELRF modeling framework calendar year trends cannot be estimated or controlled for going forward (in any prediction)..
In the PTF modeling framework we identify (build) a model that replicates the volatility in the data. This way, model specification error is removed (almost) completely. A further test can be conducted to ensure absence of model specification error.Three triangles are simulated from the identified PTF model and it is shown that it is impossible to distinguish in respect of variability between the real triangle and the simulated triangles. QED.
Also see demonstration videos 9.1-9.5 to see how the bootstrap can be used to show that the Mack method can give false indications whereas the identified PTF model replicates the volatility in the real data.
2.3 Triangle Group COMPA-volatile paid losses with stable calendar year trends
The triangle group Compa has extremely volatile paid losses. A good model measures this volatility and projects it into the future based on explicit assumptions. Even though the data are extremely volatile, the reserve distributions (beyond the evaluation period) estimated nine calendar periods earlier are the same as the ones estimated at the current evaluation period, because the calendar year trend is stable. Moreover, the distributions of the (161) observations left out in the last nine calendar periods are forecast accurately nine calendar periods ago using only 91 observations!
Three triangles are simulated from the model and it is shown that it is impossible to distinguish in respect of variability between the real triangle and the simulated triangles.
The residuals in ELRF look very bad. Not only do link ratio methods not capture the trend structure, the error structure is not symmetric. That is, the log normal distributions on a dollar scale are very skewed because the corresponding normal distributions on the log scale (in PTF) have a high variance. The data must be modelled on a log scale!
2.4 WC California, Reserve Upgrade Myths and Case Reserve Estimates (CRE) versus Paid Losses
A Californian Workers Comp portfolio exhibits stable calendar year trend for the last ten years, yet many companies lost much money in this business. A portfolio belonging to Frontier exhibits high calendar year trends for many years prior to its closure by the New York insurance department. Why would you close a company that has had the same high trend for many years? A total loss reserve upgrade myth is also debunked. Measurement of calendar year trends (and their volatility) is one of the critical assumption used in forecasting probability distributions of reserves.
Case Reserve Estimates and Paid Losses are modelled separately. From their respective model displays one can tell almost instantly when this company was sold. In the two years prior to the sale, whilst negotiations were conducted, the case reserve estimates decreased by almost 30% a year, yet the paid losses were always increasing. The reinsurers involved in providing aggregate stop loss cover for this transaction lost a lot of money! This kind of information cannot be extracted from the incurred data and moreover link ratios for the incurred data have no predictive power. They are also information free! For another real live example Case Reserve Estimates lag paid losses in respect of calendar year trend changes.
2.5 Triangle Group LR High - Mack Method gives results much too high!
Application of the Mack Method, equivalently, volume weighted average link ratios give mean forecasts for the cumulative paid losses array that are much too high. This is immediately seen by examining the residuals versus calendar years- they exhibit a very strong negative trend. This means that the calendar year trend measured by the link ratio methods (including Mack) is much higher than the trend in the data. Of course, methods in the ELRF modeling framework do not have descriptors of trends measured. However, it is the residuals that inform us about the difference between the trend in the data and the trend measured by the method.
To illustrate the ideas we simulate a triangle with a 10% calendar year trend and calculate residuals by setting the trend in the method to be 20%.
PTF modeling of the paid losses, case reserve estimates and number of claims closed arrays provide much information with respect to each loss development array and their interrelationships. Forecasting with the most recent calendar year trend, the lowest experienced up to date, in the paid losses produces much lower answers than Mack. The calendar year trends in the case reserve estimates and number of claims closed arrays provide some evidence that the future trend in the paid losses may reduce further. This means that the default forecast in the paid losses is on the conservative side (which is much lower than based on link ratios). Most importantly, in the PTF modeling framework, assumptions are explicit, can be controlled by the actuary, and can be related to past experience.
Also see demonstration videos 10.1-10.4 to see how the bootstrap can be used to show that the Mack method can give false indications whereas the identified PTF model replicates the volatility in the real data.
2.6 Three layers 1Mxs1M, 2M and 1M, pricing and aggregate distributions
For three layers, limited $1M, $1Mxs$1M, limited $2M, the trend structure is the same and residuals are very highly correlated. For the layer $1Mxs$1M the calendar year trend estimate is subject to high uncertainty that is it is non- credible, equivalently, insignificant. This is due to high process variability in the layer. The distributions of aggregate losses for calendar years, accident years and grand total are obtained by simulating from the log normal distributions (using their correlations) projected for each cell. Different prospective and retrospective adverse development cover programs are designed for the layer $1Mxs$1M.
In the next chapter we make use of the high process correlations between the three layers to design a composite model that relates the three layers (triangles).
2.7 Uneven sampling periods and updating the database
Loss development arrays can now be specified with more frequent valuation dates than accident periods. For example, arrays can be specified with annual accident periods and monthly development and calendar periods. This new feature results in two important applications: more regular reserve valuations and valuations of short tail lines such as disability and health insurance.
In this video, the uneven sampling period feature is demonstrated along with updating triangle groups, monitoring and forecast tracking. Once you have a model at year end 2006, say, there is no need to design a new model at year end 2007. Updating, monitoring and forecast tracking are effortless and seamless.
2.8 How can we tell that data modeled by Murphy et al is not real?
In the paper Manually Adjustable Link Ratio Model for Reserving by Murphy et al on the CAS web site, a dataset is modeled using the Mack method. Notwithstanding that the Mack method for these data is completely unsound we demonstrate effortlessly that the data are not real. Our submission on “Meaningful Intervals” explains this. The fact that the data are not real was subsequently corroborated by Daniel Murphy at the CLRS held in Washington 2008.
3. MPTF modeling framework
3. The Multiple Probabilistic Trend Family (MPTF) modeling framework
The MPTF module of ICRFS™ is used to design a composite model for multiple lines of business, multiple segments and multiple layers. It has many benefits including assessment of level of diversification, design of optimal outward reinsurance and credibility modeling.
3.1 Introduction to MPTF, two Lines of Business: LOB1 & LOB3 and two types of correlations
In this video, the MPTF modeling framework is introduced. This modeling framework has diverse applications including: modeling multiple lines of business, capital allocation by Line of Business based on a covariance formula, pricing layers including excess layers, credibility modeling, and producing a company wide report.
Correlation, linearity, linear regression, weighted least squares and normality are intimately related concepts. Two lines of business LOB 1, LOB 3 are first studied in the PTF modeling Framework. The optimal PTF models are run in the MPTF modeling framework and optimised. Two types of correlations, namely, process correlations and parameter estimates correlations are estimated from the data and are an integral part of the optimal model. These correlations induce correlations between any two pair of cells between the two lines of business and hence correlations between all aggregate forecast distributions between the two lines of business. The correlation for the total reserve distributions between the two lines is very high! Level of diversification is assessed and is compared. Capital allocation by LOB is also compared.
3.2 Clusters: LOB A - J and SDFx40
Two examples are presented to show the use of clusters. In particular, LOB A B C D E F G H I J (10 lines of business) and SDFx40 (40 lines of business). Analysis in MPTF is limited only by the computer hardware and processing time - the larger the number of lines or segments, the more space and time is needed for processing.
Methods of creating clusters are discussed including manual creation of clusters - in this case via modification of existing clusters. The new optimisation method of optimising only within clusters is also utilised.
3.3 Layers: 1M, 2M, 1Mxs1M and 0-25, 25-50,...
For the three layers limited $1M, $1Mxs$1M, limited $2M a composite model is designed in MPTF. The optimal composite model contains very high process correlations and parameter estimates are also highly correlated. The model provides consistent estimates of reserve distributions for the layer limited $2M and the aggregate of the two layers limited $1M and $1Mxs$1M. Perhaps this is not surprising as the layers are additive. It is also found that outward reinsurance where each individual loss limited is to $1M ($1,000,000) is not more capital efficient than outward reinsurance where each individual loss is limited $2M ($2,000,000).
For a layered composite data set 0-25K, 25K-50K,…, 150K-200K, it is also found that the coefficient of variation of the net reserves limited to $xK does not depend on x!
Highest process correlations are between neighbouring layers. The development period peak shifts to the right as you move to higher layers. Calendar year trends are statistically the same for neighbouring layers and any change in trends occur in the same periods for all layers.
3.4 Gross versus Net of Reinsurance - same trend structure with high process (volatility) correlation
For another study involving gross data versus data net of reinsurance, the retrospective outward reinsurance program (that has been in place for many years) is far from optimal from the point of view of the cedant. Gross data and net of reinsurance data have both high process correlation and parameter estimates correlations.
3.5 Credibility modeling: CompA, Maa951 and Company A, Company B
CompA (modeled in Video 2.1) contains paid losses for a company writing relatively low exposures. The paid losses are extremely volatile, yet calendar year trend is stable. As a result of high process variability the estimate of the calendar year trend is not significant, equivalently, it is not credible. The triangle group Maa951 contains industry data for the same line of business. It has very little process variability and much higher (and unstable) calendar year trends than Compa. The Compa component of the composite (credibility) model has a significant (credible) calendar year trend. Some of the development period trends are also credibility adjusted, but not all of them. Which trends are credibility adjusted depends on the information in each triangle and their inter-relationships! The industry and the company experiences are very different, both in terms of trends and process variability.
In a study involving two companies, Company B is a triangle that has very few accident years. Company A is the same line of business but has larger dimensions. The "information" in Company A is used to design a credibility model for Company B. Calendar year and development year trends are credibility adjusted. Process variability that is intrinsic to the company is never adjusted.
4. Capital management
4. Capital Management of all long tail LOBs
One great benefit of ICRFS™ is that you can manage and measure all your long tail liability risks with a single composite model. Only one model for each company!
A single composite model measures the reserve, underwriting and combined risks for each LOB and the aggregate.
One double click loads the model and reveals pictorially the volatility structure of each long tail LOB in your company and their inter-relationships (correlation structures). All the critical financial information such as risk capital allocation by LOB and calendar year, and Tail Value-at-Risk for different time horizons can be computed in a matter of seconds. A company-wide report can be created effortlessly with a single report template.
This chapter discusses and demonstrates using real data the capital management of long tail lines of business. The data are extracted from A.M.Best Schedule P 2006 and includes Berkshire Hathaway, The Hartford, SwissRe and others.
For the selected companies composite models are designed to measure
the volatility within each line and the correlation structure between
them. The composite model is used to allocate risk capital by LOB and
calendar year, and measure the combined reserve and underwriting risks.
4.1 Common drivers and Process Correlation
How do we know if two LOBs have common drivers?
Gross and net of reinsurance data have very much the same trend structure and high process correlation because they have common drivers (especially in the calendar year direction). This is illustrated with a real life example.
However, it is very rare to see two LOBs with similar trend structure or significant process correlation. That is, they do not have common drivers.
This video also illustrates that for Berkshire Hathaway the process correlation between LOBs CAL and PPA is zero whereas for Swiss Re the same LOBs is significant (0.53).
4.2 Design of a single composite model for Berkshire Hathaway - 15 LOBs (schedule P data)
A composite model is designed for all the long tail LOBs of Berkshire Hathaway. The starting point is the optimal model designed (identified) for each LOB in the Probabilistic Trend Family (PTF) modeling framework.
Clusters are identified based on process correlations between the LOBs. LOBs belong to the same cluster if the process correlation between them is significant. For members in different clusters the process correlation is insignificant and is, accordingly, set to zero.
We find that most LOBs do not have significant process correlation. Moreover, LOBs do not share the same trend structure and process variance. Accordingly they do not have common drivers.
The composite model that describes the trend structure and process variance in each LOB pictorially and the process correlations between them produce a wealth of critical information. All this information is conditional on an explicit set of assumptions that are transparent and auditable.
Forecasting output includes means and standard deviations for:
- Log normal distributions for every projected cell for every LOB
- The aggregate of all LOBs for each projected cell
- Totals by accident year, calendar year, and the equivalent for the aggregate for each LOB and the aggregate of LOBs
The above output is created for the current and prior accident years (reserves), for future underwriting years, and the combined reserve and underwriting year risks. Forecast summaries are also provided.
4.3 Berkshire Hathaway (Schedule P data) and allocation of risk capital
We continue from the previously designed forecast scenario for Berkshire Hathaway and study the forecast summaries.
Forecast summaries include:
- Reserve distribution correlations
- Risk capital allocation (percentages) by LOB
- Payment streams by calendar year for each LOB and the aggregate
- Risk capital allocation (percentages) by calendar year for each LOB and the aggregate
Risk Capital allocation by LOB and calendar year is based on a variance/covariance formula.
Calendar year payment streams are critical for the cost of capital calculations. These payment streams are inseparably related to the interaction between of the development period and calendar period parameters. (An accurate projection of the calendar year streams cannot be obtained in any other way).
The volatility of ReA is examined. The process volatility in the past is high so we expect to see the same volatility when we project from the model into the future.
Forecast scenarios going forward are adjusted so that estimates of the means of the reserve distributions correspond to reserves held. The CV of the aggregate is smaller than the CVs for most of the individual lines.
4.4 VaR, T-VaR, Risk Capital Allocation, and Underwriting risk charge versus Reserve risk charge
This video is a continuation from the previous video: Berkshire Hathaway and allocation of risk capital.
Since there is no analytical form for the sum of log normals, we simulate from the projected correlated log normals in each cell for each LOB to find the distribution of aggregates.
Graphs of risk capital allocation for selected VaRs and T-VaRs are discussed.
It is shown that the combined risk charge for reserve and underwriting risk is less than the sum of the individual risk charges.
4.5 Berkshire Hathaway LOB ReA versus the aggregate of all LOBs and simulation of a composite dataset from the composite model
The LOB ReA has the largest CV and if this were the only line written by Berkshire Hathaway it would require a large amount of risk capital. Berkshire Hathaway affords substantial risk diversification credit as a result of the reserve distributions exhibiting essentially zero correlation.
A composite dataset is simulated from the composite model for all the long tail LOBs. It is shown to have the same risk characteristics as the real data.
4.6 Comparison of Berkshire Hathaway, Swiss Re and The Hartford (Schedule P data)
The risk characteristics of the three companies are compared. The same LOBs have different CVs, different correlations and different capital allocations by calendar year. Capital allocation by LOB is also different. Indeed, even the mean payment streams by calendar year are different.
Updating the composite triangle group that includes data, models and forecast scenarios is illustrated.
4.7 Excel based Report for Berkshire Hathaway (a Company Wide Report)
A report is generated in Excel for Berkshire Hathaway using a report template that exhibits reserve summaries for the aggregate across all LOBs and each LOB by accident year and calendar year. Capital allocation tables and graphs are also given for specific VaR.
One great benefit of an ICRFS database is that all reports are linked to the corresponding triangle groups and accordingly a report can be found with just a few mouse clicks.
5. Solvency II one year and ultimate year risk horizons
Solvency II one year and ultimate year risk horizons and IFRS 4 metrics including fungibility and ring fencing: SCR, Best Estimate of Liabilities (BEL), Technical Provisions (TP) (Fair Value of Liabilities), and Market Value Margins (MVM) (Risk Margins) for the aggregate of long-tail LOBs
In the following eight videos, we present a mathematically tractable solution to the Solvency II risk metrics for the one year risk horizon that is not recursive or circular. Our solution is based on relevant Solvency II directives and consultation papers.
The ultimate year risk horizon is quite straightforward and is described here.
In respect of IFRS 4 we also discuss and demonstrate fungibility and ring fencing between LOBs and along calendar years (going forward).
It is only in the Probabilistic Trend Family (PTF) and Multiple PTF (MPTF) modeling frameworks that parameter uncertainty and forecast assumptions going forward are explicit, auditable, and can be monitored in a sound probabilistic framework.
The first calendar year is in distress at the 99.5th percentile, that is 1 in 200 times. Accordingly, in order to compute Solvency II metrics, it would typically be necessary to conduct 20 million simulations of the unconditional distributions of the future calendar year liability streams for which approximately a subset of 100,000 sample paths are in distress. This subset of sample paths is used to compute the conditional distributions of the payment streams from the second year onwards conditional on the first year being in distress. As our proprietary algorithms can simulate correlated lognormals conditional on the sum of lognormals (being at 99.5%), we do not take this approach. Instead, we can run 100,000 simulations unconditionally, and another 100,000 conditional simulations - a significantly faster algorithm with no loss of accuracy.
Statistical and mathematical technicalities are treated in the first video.
The second video considers a real life example comprising six LOBs. Solvency II metrics are computed (assuming full fungibility across all LOBs) for the most volatile LOB and the aggregate of all LOBs to illustrate, amongst other things, risk diversification credit of SCR and Technical Provisions.
In the third video it is shown that for the aggregate of the six LOBs,
Technical Provisions + SCR = Undiscounted Reserves (total capital at inception),
assuming a risk free rate of 4% and a spread of 6%. This is due to risk diversification credit of writing the six LOBs that are uncorrelated.
This result is far from true for the most volatile LOB4, were it the only one written!
Each year, Solvency II metrics are recomputed. In the fourth video, we discuss conditions under which estimates of prior year ultimates and related solvency II metrics are statistically consistent on updating.
In the fifth video we compare SII and IFRS 17 metrics, namely, SCR, Risk Margins and Fair Value of Liabilities, not allowing for 'surpluses' (total calendar year loss less than the mean) in one LOB to pay for a high loss (greater than the mean) in another LOB. That is, the 'surplus' is ring fenced within the LOB, so that there is no fungibility.
Indeed, portfolios of LOBs can be set up so that there is complete fungibility across LOBs in the same portfolio, but no fungibility (surplus sharing) between LOBs in different portfolios. That is, each portfolio is ring fenced.
We also consider another option and that is fungibility along calendar years going forward. That is, if the total loss in a calendar year (2+) is less than the mean, then the surplus can be used to pay for losses in future calendar years that exceed the mean.
In the sixth video we look at distressed samples, that is samples for which the first calendar year is in "distress" at the 99.5 percentile, including a situation where we remove all process variability and only have parameter uncertainty (volatility).
The seventh video considers the SII Ultimate year risk horizon with all the possible scenarios in respect of ring fencing defined portfolios and along calendar years going forward.
5.1 Our solution for calculating the long-tail liability Solvency II risk measures for the one-year risk horizon
This video discusses Best Estimates of Liabilities (BEL), Market Value Margins (or Risk Margins), Technical Provisions (TP) (or Fair Value of Liabilities), and Solvency Capital Requirements (SCR). It is emphasized that calendar year loss distributions and their correlations are necessary to compute any solvency II risk measure.
Our solution to the one-year risk horizon is shown to arise directly out of relevant directives and consultation papers. Our solution is not recursive or circular contrary to other proposed solutions.
For the one-year risk horizon, risk capital is raised at the beginning of each year. The cost of raising the risk capital, the Market Value Margin (MVM) or premium on the risk capital, is paid to the capital providers at the end of each year along with any unused risk capital. The sum of the MVMs and the Best Estimate of Liabilities (BELs) for each calendar year is the Technical Provision (also referred to as Fair Value of Liabilities).
We show that based on the directives and definition of the first calendar year being in distress that SCR is given by the equation,
SCR = VaR(1) + ΔTP,
where VaR(1) is the VaR99.5% for the first calendar year and ΔTP is the additional technical provisions for the subsequent years if the first year is in distress.
The SCR is required to cover the losses for the distressed year (VaR99.5%) and to restore the Fair Value of Liabilities (Technical Provisions) of the balance sheet at the beginning of the second year. The ΔTP is allocated to each year as required to ensure that there is sufficient monies to meet the additional BEL and sufficient MVM to raise the risk capital in the event of the first (next) calendar year being a distressed year.
5.2 Solvency II risk measures for a real life example involving six LOBs
The second video considers a real life example comprising six LOBs. Solvency II metrics are computed for the most volatile LOB and the aggregate of all LOBs to illustrate, amongst other things, risk diversification credit of SCR and Market Value Margins (a component of the Technical Provisions).
The most volatile LOB (LOB 4) possesses much process variability and a large degree of parameter uncertainty. The base development year trend is not negative until development year six. As a result of this, and a high calendar trend assumption going forward, it takes ten years before 50% of the total reserves are paid out. More importantly, the high correlations of the calendar year paid loss distributions have a large impact on the additional technical provisions required if the first (calendar) year is in distress, resulting in an SCR that is a high proportion of BEL.
By contrast, for the aggregate of the six LOBs, 50% of the total reserves are paid out in the next two years and the paid loss calendar year correlations are comparatively low. Furthermore, there is only significant (low) process correlation between two LOBs. Accordingly, there is significant diversification credit in respect of SCR and risk capital allocation by writing the six LOBs instead of just the single, most volatile LOB.
It is also important to point out that the most volatile LOB4 comprises only 11.2% of the total mean reserve across the six LOBs. Next year in distress is principally driven by the largest LOB3 which comprises 66% of the total mean reserve.
Indeed, if only the most volatile line was written, then the SCR as a percentage of BEL, is close to 100%! For the aggregate, however, the SCR as a percentage of BEL is only 11%.
Also see video chapter 5.3 for a comparison of total capital and undiscounted reserves.
5.3 Comparison of TP+SCR with undiscounted BEL- Risk diversification of SCR and MVM
In the third video it is shown that for the aggregate of the six LOBs,
Technical Provisions + SCR = Undiscounted Reserves,
assuming a risk free rate of 4% and a spread of 6%. This is due to risk diversification credit of writing the six LOBs that are uncorrelated.
This result is far from true for the most volatile LOB4, were it the only one written!
In practice, we conclude that Solvency II capital requirements are not expected to be a burden on insurers or reinsurers with good diversification between LOBs, even when highly volatile lines are written as part of their portfolio.
5.4 Consistency of estimates of prior accident year ultimates and Solvency II metrics on updating
It is first explained using a simulation example that calendar year trends project onto development years and accident years. Consequently, estimates of prior accident year ultimates and Solvency II risk measures are statistically consistent on updating only if assumptions going forward are consistent.
One does not want to be in a position where the distress situation in the next calendar year is due to model error distress rather than outcomes in the tail of the projected loss distributions.
A real life example is considered involving updating that illustrates the importance of explicit assumptions going forward and shows consistency of estimates of prior accident year ultimates and Solvency II metrics.
5.5 SII and IFRS 17 metrics excluding fungibility across LOBs and calendar years going forward, relative to assuming fungibility
Ring fencing and fungibility are also discussed in QIS5, SCR11.
In this video we compare SII and IFRS 17 metrics, namely, SCR, Risk Margins and Fair Value of Liabilities, not allowing for 'surpluses' (total calendar year loss less than the mean) in one LOB to pay for a high loss (greater than the mean) in another LOB. That is, the 'surplus' is ring fenced within the LOB.
It turns out that for the specific example under consideration involving the six LOBs there is very little loss in diversification by ring fencing.
We also consider another option and that is fungibility along calendar years going forward. That is, if the total loss in a calendar year (2+) is less than the mean, then the surplus can be used to pay for losses in future calendar years that exceed the mean.
5.6 Distressed Samples driven by process volatility and parameter volatility
One of the conditions of Solvency II one-year risk horizon is that the metrics are all based on the first year (next calendar year) being in distress at the 99.5% percentile.
The next calendar year is in distress based on two (related) drivers, namely, process volatility, parameter volatility (uncertainty) or both.
In this video we study distressed samples, that is samples for which the first calendar year is in "distress" at the 99.5 percentile, including a situation where we remove all process volatility and only have parameter volatility (uncertainty).
5.7 The Ultimate Year Risk Horizon
The Solvency II regulatory Capital Requirements are based on the one-year risk horizon.
However, in respect of running the business the company may decide to consider the ultimate year risk horizon.
In this video we compute the SII and IFRS 4 metrics for the aggregate of the six LOBs considered in video chapters 5.2 and 5.3 for the ultimate year risk horizon and compare the metrics with those obtained for the one-year risk horizon. Naturally, the ultimate year risk horizon is much more onerous in respect of Risk Capital and Risk Margins than the one-year risk horizon.
Four possible scenarios for fungibility by LOB and calendar year are also considered.
5.8 Solvency II and multiple distress years
In this video we explore the ability of the ICRFS Solvency II module to take into account more than one future year in distress. This applies in cases where the Solvency II paradigm includes the consideration that future years will also need to be adjusted for the requirement of rebalancing after the following twelve months turns out to suffer losses at a distress level corresponding to the 99.5th percentile.
Solvency II output is compared for a sample dataset with 1, 2, 3 and 4 future years in distress. Changes are seen to occur only in the MVM, these changes are traced through the tables and explained.
6. Reports
6.1 Excel based Report for Company B for all LOBs (Company Wide Report)
A report is generated in Excel for Company B using a report template that exhibits reserve summaries for the aggregate across all LOBs and each LOB by accident year and calendar year. Capital allocation tables and graphs are also given for specific VaR.
One great benefit of an ICRFS database is that all reports are linked to the corresponding triangle groups and accordingly a report can be found with just a few mouse clicks.
7. Best's Schedule P
7. ICRFS™ and A.M. Best Schedule P - giving your company a competitive advantage.
This chapter illustrates the wealth of information that can be obtained with ICRFS and the A.M. Best Schedule P data to give your company a competitive advantage.
The Best's Schedule P data are imported into an ICRFS™ relational database. The database is used to study a number of companies in order to assess their different risk characteristics and compare them to the industry. The companies have different trends and process variability which is also different to the industry.
In addition, a company - called company C for the purpose of this demonstration, is shown to be significantly under-reserved. The ELRF modeling framework is used to show that standard link ratio techniques applied to paid losses or incurred data under-estimate the true trends for this company, suggesting that standard link ratio techniques were used to set reserves.
It is also explained that if a company experiences a calendar year trend of x% for many years and projects using this trend it should be increasing its price (premium) each year by at least x% and its total reserves each year by at least x%, in order to maintain consistent estimates of prior year ultimates.
8. Importing data and COM
8. Importing of data and COM Automation
8.1 Importing triangular data from other databases and manipulating objects in the ICRFS™ database
This chapter illustrates the simplicity of using COM automation to import triangular data from Excel spreadsheets into an ICRFS™ database. COM scripts is also used to manipulate objects in the database and run the modeling Wizard. The data can be imported from any other database including MS Access, Oracle and SQL Server.
8.2 Importing triangular data from unit record transactional data
This chapter illustrates the importing of triangular data from unit record transactional data into an ICRFS™ database using COM scripts. COM script is also used to manipulate objects in the ICRFS™ database. The example involves unit record data that reside in an MS Access database, but similar COM script can be written if the data reside in Excel, Oracle or SQL Server.
8.3 Importing triangular data including layered triangles from unit record data
This chapter illustrates the importing of triangular data including layered triangles from unit record transactional data into ICRFS™ using COM. The COM script is shown to be flexible and different layers can be extracted from the unit record transactional data. It is easy to add, remove, or modify queries.
9. Additional applications
9.1 Pricing high layers (low frequency/high severity) and relationships between gross and net of reinsurance data.
The findings in this chapter corroborate some of the surprising findings in chapter 3. This should have a major impact on reinsurance programs for long tail liabilities.
Using real life data it is shown how to price higher layers even though the triangles for the higher layers are replete with zeros.
A composite model is designed for the layered composite data set Lim 0.5M, Lim 1M,..., Lim 4M and Groundup. Both process correlations and parameter correlations between the layers are very high. These induce high correlations in predicted lognormals between the cells in any two layers.
To price a layer such as 1Mxs1M, for example, the differences of the simulated values for Lim 2M and Lim 1M are used that incorporates a strong covariance term between the two layers. It is found that from the point of view of the cedant the coefficient of variation of net reserves is invariant with regard to attachment points and is almost the same as the coefficient of variation of the gross reserves. Accordingly, the percentage capital required above the mean to subscribe to a particular percentile is also invariant with attachment points.
Insureware's extensive database has many other examples of this phenomenon.
Therefore, there is much empirical evidence to suggest that excess of loss (on individual losses) is not capital efficient for a cedant.
Chapter 3 considered an example where it was shown that the coefficient of variation of net reserves is the same as the coefficient of variation of gross reserves.
Two further real life examples are given here. The net of reinsurance and gross data are modeled in the MPTF modeling framework. The composite models include the high process and parameter correlation between the two triangles.
10. The bootstrap
10. The Bootstrap: how it shows the Mack method doesn't work
"To
kill an error is as good a service as, and sometimes even better
than, the establishing of a new truth or fact!" |
||
| - Charles Darwin |
Bootstrap samples of the Mack method provide another compelling reason, amongst the numerous others, that it does not work. That is, it gives grossly inaccurate assessment of the risks.
The Mack method is a regression formulation of volume weighted average link ratios, the latter also known as the chain ladder method.
The idea behind the bootstrap is an old one. It is a re-sampling technique popularized by Brad Efron (1979) in his celebrated Annals of Statistics paper. Efron drew our attention to its considerable promise and gave it its name.
The bootstrap technique is used to calculate standard errors of parameters, confidence intervals, distributions of forecasts and so on. Typically, it is used when the sample size is small so that distributional assumptions cannot be tested and asymptotic results are not applicable. It also has applications to large sample sizes where distributional and model assumptions can be tested but the mathematics for computing forecast distributions is intractable.
The bootstrap technique is not a model and it does not make a bad model good.
Bootstrap samples are generated subsequent to a model being fitted to the data. A bootstrap sample (pseudo-data) has the same features as the real data only if the model satisfies assumptions supported by the data.
According to Francois Morin ("Integrating Reserve Risk Models into Economic Capital Models"):
"Bootstrapping utilizes the sampling-with-replacement technique on the residuals of the historical data",
and
"Each simulated sampling scenario produces a new realization of "triangular data" that has the same statistical characteristics as the actual data." (Emphasis added)
This is worth repeating.
"...that has the same statistical characteristics as the actual data."
Bootstrap samples have the same statistical characteristics as the actual data
only
if the model has the same statistical characteristics as the actual (real) data.
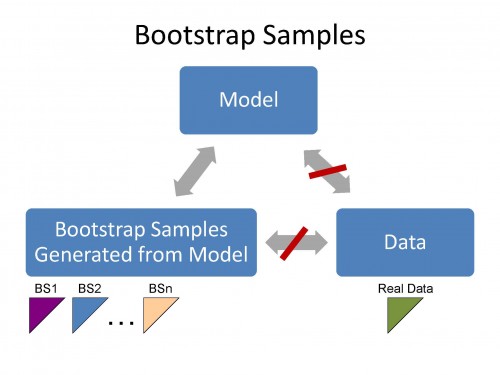
The bootstrap samples have the same statistical features as the Model. If the Model does not have the same statistical features as the data then the bootstrap samples cannot have the same statistical features as the data.
Accordingly the bootstrap technique can be used to test whether the model is appropriate for the data.
In these video chapters we compare bootstrap samples for the Mack method versus bootstrap samples based on the optimal PTF model. We find that bootstrap samples (pseudo data) based on the Mack method (and related methods) do not reflect features in the real data - you can easily distinguish between the real data and the bootstrap samples. However, you cannot distinguish between bootstrap samples based on the optimal PTF model and the real data!
If the bootstrap samples do not replicate the features in the real data then the model is bad.
We study two LOBs;
- Triangle Group (TG) "ABC BS"
- Triangle Group (TG) "LRHigh BS"
Both datasets are real with changing calendar year trends. Moreover, the incremental paid losses in the "LRHigh BS" TG are heteroscedastic versus development period. That is, percentage variability varies by development period. This is another feature that the Mack method cannot capture, as shown by the Mack bootstrap samples.
In each case it is shown that the Mack method does not capture calendar year trends and the corresponding bootstrap samples bear no resemblance to the real data. This is not the case with the optimal PTF model.
10.1 Introduction to the Bootstrap
This video provides an introduction to the bootstrapping re-sampling technique using a PowerPoint presentation. It is emphasized that (i) standardized residuals residuals represent trends in the data minus trends estimated by the method; (ii) bootstrap samples based on a good model have the same salient features as the real data, and (iii) the bootstrap technique works if the weighted standardized residuals of a model come from the same distribution. If there is any structure in the residuals corresponding bootstrap samples do not resemble features in the real data. Accordingly, the bootstrap technique can be used to test the validity of the model for the (real) data.
10.2 Overview of the Mack method and the PTF modeling framework
The Mack method is a regression formulation of the link-ratio technique termed volume weighted averages. We use a real data set to explain the Mack method and how to calculate residuals. An extensive study of the Mack method and its relatives that all belong to the Extended Link Ratio Family (ELRF) modeling framework is given in video chapter 1.2 The Link Ratio Techniques (LRT) and the Extended Link Ratio Family (ELRF) modeling frameworks. Examples of Mack and other related methods fitted to real data is given in video chapter 2. Applications of the PTF and ELRF modeling frameworks.
An overview of the Probabilistic Trend Family (PTF) modeling framework is also given using a simulated data set. A more extensive study of the PTF modeling framework and its applications to real data is given in Chapter 1.2 and Chapter 2.
The Mack method does capture calendar year trends as explained in video Chapter 1.2. Here also by way of a simulation we show that when we have data with a 10% calendar year trend the Mack method does capture the trend but there are no descriptors of it.
10.3 Bootstrap TG ABC BS
These data have major calendar year trend shifts that are quantified by the optimal PTF model.
We first create a bootstrap sample of the triangle values assuming they all come from the same distribution, that is, we randomly reshuffle the values into the different cells. This is done by setting all fitted parameters to zero. In this case bootstrapping the residuals is the same as bootstrapping the observations. Naturally the bootstrap triangle has very different structure to the real data. Most practitioners would argue that this is a silly thing to do. We agree! Furthermore, it is just as silly to bootstrap the residuals if the residuals of a model have any type of structure in them. That is, the scaled residuals are not random from the same distribution.
The Mack method applied to the corresponding cumulative array has residuals that exhibit calendar year trend changes (structure). That is, the residuals are not random from the same distribution. Bootstrap samples based on the Mack method are easily distinguishable from the real data, yet bootstrap samples based on the optimal PTF model are indistinguishable from the real data.
For another study of this particular LOB you can view video Chapter 2.2 ABC.
10.4 Bootstrap TG LR High BS
The residuals of the Mack method apply to these data exhibit a very strong negative trend. This means that the trends estimated by the (Mack) method are much higher than that in the data. Accordingly, the answers are biased upwards by about a factor of two. Bootstrap samples based on the Mack method are easily distinguishable from the real data, yet bootstrap samples based on the optimal PTF model are indistinguishable from the real data. The real incremental data has major calendar year trend shifts, and the quantity of process variation (on a log scale) varies by development period. Neither of these features are captured by the Mack method.
For another study of this particular LOB you can view video Chapter 2.5 LR High.