Predictive Aggregate Loss Distributions (the PALD sub-module)
A model identified in the PTF modeling framework predicts (lognormal) distributions and their correlations for every cell in the forecast table.
Since there are no analytical distributions for the aggregate of lognormals, the PALD (Predictive Aggregate Loss Distributions) sub-module simulates from the correlated lognormals in all the cells to obtain distributions of reserves by accident year, calendar year, and the total.
The simulated values are used to compute Quantile (Percentile) and Value at Risk (V@R) tables. They can also be used to price Adverse Development Cover (ADC) and other reinsurance programs.
For a (composite) model identified in the MPTF modeling framework, correlations in the forecast distributions between lines of business are also incorporated in the simulations to obtain distributions of aggregates of lines of business. This also applies to other datasets, for example, segments or layers.
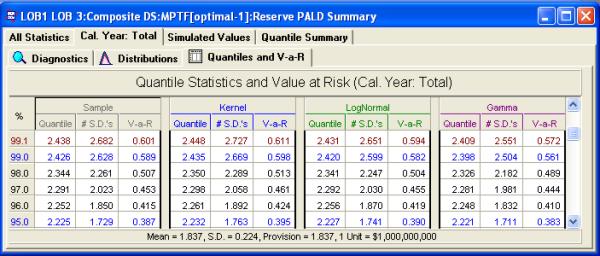
Quantile and Value-at-Risk table
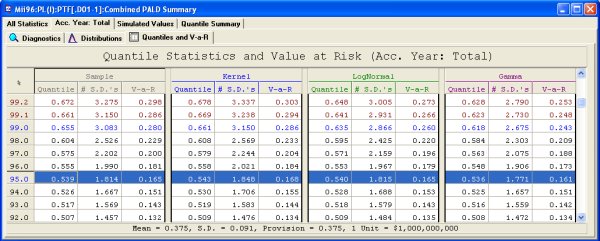
The above is a sample output table from a PALD simulation. Quantiles along with the value-at-risk can be computed at intervals of 1% between 1% and 99%, 0.1% between 99 and 99.9, and at 99.95.
Distribution graph
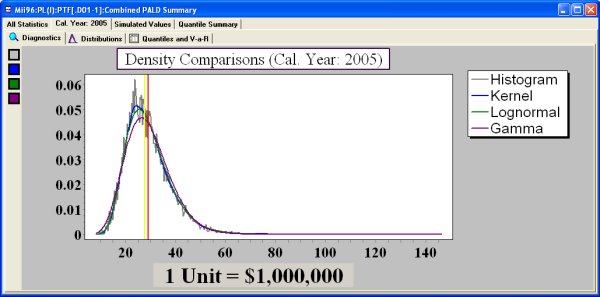
Diagnostic graphs can be produced for the sample distribution for individual calendar years - such as 2005 above - as well as the total. Similar graphs can be constructed for accident years.
Optimal Reinsurance programs
Reinsurance quantiles can be computed for each layer: insurerer, reinsurer, and retrocessionaire along with the value-at-risk. The PALD sub-module computes insurer's, reinsurer's and retrocessionaire's distributions with associated premium rates and standard errors.
Example Adverse Development Cover output (for specified limits) is shown below. Provision in the module is made for discounting for each layer as applicable.
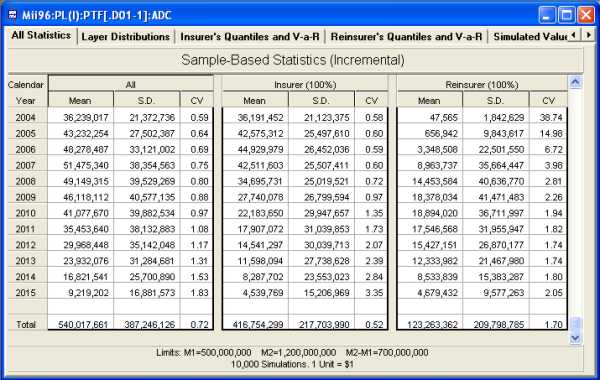
In the above example, the insurer's coefficient of variation would drop from 0.72 to 0.52 should this particular adverse development cover be taken - for this forecast scenario. Optimal reinsurance programs can easily be determined by rerunning the ADC for different settings and for alternative forecast scenarios.
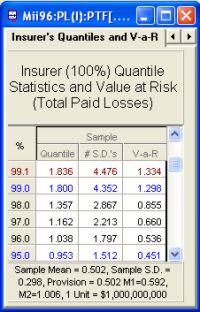
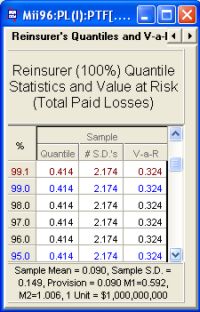
The insurer's and reinsurer's value-at-risk tables are produced (as above) showing the value-at-risk for each party assuming the adverse development cover is applied.
PALD and MPTF
MPTF allows the modeling of multiple triangles simultaneously - whether different lines of business or layers within the same line. For this type of model, PALD allows the construction of an overall, company-wide picture of the total reserve distribution. The distribution of the reserves for the aggregate of the multiple lines, layers, or segments can be calculated.
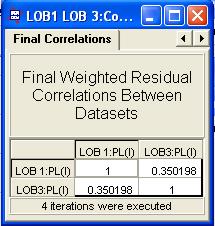
The distribution of the aggregate when using MPTF takes into account any correlation between the lines or layers. In the case of layers particularly, high correlation can substantially change the distribution of the total reserves and thus the overall risk from the layers.
For example two lines of business have the following correlation between the lines. In this example, the correlation is relatively low, 0.35, and there is little difference between the calculations of the aggregate assuming no correlation between the lines of business and the aggregate distribution assuming the estimated correlation of 0.35.
The quantile and value-at-risk table for the aggregate distribution is shown below.